Python拟合吸附等温线并计算吸附焓
前一阵子帮人用C++写了一个用以计算吸附焓的简单小程序,仅实现了得到吸附等温线方程后计算吸附焓的功能。最近重拾Python语言,在尝试了Python的各类库之后对其爱不释手。遂尝试着将这个程序用Python完善了一下,实现了数据读入,拟合,计算吸附焓一系列流程。
作为一个新手,写程序的过程依然很揪心。好在换用了Anaconda后的Jupyter Notebook十分友好,可以在每个cell中直接运行查看结果进行调试。在经历了不断地与错误信息斗争后,终于磕磕绊绊地将想要的功能实现了。所以在这里记录一下学习到的一些语法知识以及程序目前的缺陷。
程序内容
1
2
3
4
5
6
7
8
9
10
11
12
13
14
15
16
17
18
19
20
21
22
23
24
25
26
27
28
29
30
31
32
33
34
35
36
37
38
39
40
41
42
43
44
45
46
47
48
49
50
51
52
53
54
55
56
57
58
59
60
61
62
63
64
65
66
67
68
69
70
71
72
73
74
75
76
77
78
79
80
81
82
83
84
85
86
87
88
89
90
91
92
93
94
95
96
97
98
99
100
101
102
103
104
105
106
107
108
109
110
111
112
113
114
115
116
117
118
119
120
121
122
123
124
125
126
127
128
129
130
131
132
133
134
135
136
137
138
139
140
141
142
143
144
145
146
147
148
149
150
151
152
153
154
155
156
157
158
159
160
161
162
163
164
165
166
167
168
169
170
171
172
173
174
175
176
177
178
179
180
181
182
183
184
185
186
187
188
189
#拟合BET数据中的吸附曲线并计算吸附焓
#Version 2.00
#以实现对数据的读取,转化单位和langmuir方程拟合并做图
#对BET软件直接生成的xls文件尚不能直接打开,需要另存为xlsx格式
#Author: lewisbase
#Date: 2019.04.08
import csv
import math
import pandas as pd
import numpy as np
import matplotlib.pyplot as plt
from matplotlib import ticker
from matplotlib import rcParams
from scipy.optimize import leastsq
GRID=30000
R=8.314510e-3
###############################################################################################
def Langmuir(c):
b=c
return y-qmax*b*x/(1+b*x)
def Langmuirfit(x):
return qmax*b*x/(1+b*x)
def Freundlich(f):
k,l=f
return y-k*x**(1/l)
def Freundlichfit(x):
return k*x**(1/l)
###############################################################################################
print("Welcome to absorption calculator! Please follow the hinds and input the right message.")
ifheat=input("Would you like to caiculate the heat of absorption?(Y/N)")
if ifheat == "Y" or ifheat == "y":
T1=input("Input the first temperature:\n")
filename1=input("Input the filename of T1:\n")
T2=input("Input the second temperature:\n")
filename2=input("Input the filename of T2:\n")
read1=pd.read_excel(filename1,usecols="L,M",header=None,convert_float=True,dtype=float,skiprows=28)
read1=np.array(read1,dtype=float)
x1=np.array([])
for x in read1[:,0]:
if not np.isnan(x):
#print(x)
x1=np.append(x1,x)
y1=np.array([])
for y in read1[:,1]:
if not np.isnan(y):
#print(y)
y1=np.append(y1,y)
read2=pd.read_excel(filename2,usecols="L,M",header=None,convert_float=True,dtype=float,skiprows=28)
read2=np.array(read1,dtype=float)
x2=np.array([])
for xbuff in read2[:,0]:
if not np.isnan(xbuff):
#print(x)
x2=np.append(x2,xbuff)
y2=np.array([])
for ybuff in read2[:,1]:
if not np.isnan(ybuff):
#print(y)
y2=np.append(y2,ybuff)
x1*=101.325
x2*=101.325
else:
T1=input("Input the temperature:\n")
filename1=input("Input the filename:\n")
read1=pd.read_excel(filename1,usecols="L,M",header=None,dtype=float,skiprows=28)
read1=np.array(read1,dtype=float)
x1=np.array([])
for xbuff in read1[:,0]:
if not np.isnan(xbuff):
#print(x)
x1=np.append(x1,xbuff)
y1=np.array([])
for ybuff in read1[:,1]:
if not np.isnan(ybuff):
#print(y)
y1=np.append(y1,ybuff)
x1*=101.325
print(x1)
print(y1)
#####################################################################################################
print("Please choose the absorption model you want to use: 1. Langmuir; 2. Freundlich\n")
model=int(input("Input the number: \n"))
while model!=1 and model!=2:
print("Sorry, this program currently only supports the above two models. Please input 1 or 2.")
model=int(input("Input the number: \n"))
if model==1:
print("You choose the Langmuir model, mission start!\n")
qmax=np.max(y1)
x=x1
y=y1
result1=leastsq(Langmuir,[1])
a1=result1[0]
#aerr1,berr1=result1[1]
xfit1=np.linspace(0,np.max(x1),GRID,endpoint=True)
b=a1
yfit1=np.array([])
for x in xfit1:
yfit1=np.append(yfit1,Langmuirfit(x))
print("The fit coefficient at {0} is: ".format(T1),a1)#,aerr1,berr1)
if ifheat == "Y" or ifheat == "y":
qmax=np.max(y2)
x=x2
y=y2
result2=leastsq(Langmuir,[1])
a2=result1[0]
#aerr2,berr2=result2[1]
xfit2=np.linspace(0,np.max(x2),GRID,endpoint=True)
b=a2
yfit2=np.array([])
for x in xfit2:
yfit2=np.append(yfit2,Langmuirfit(x))
print("The fit coefficient at {0} is: ".format(T2),a2)#,aerr2,berr2)
elif model==2:
print("You choose the Freundlich model, mission start!\n")
x=x1
y=y1
result1=leastsq(Freundlich,[1,1])
a1,b1=result1[0]
#aerr1,berr1=result1[1]
xfit1=np.linspace(0,np.max(x1),GRID,endpoint=True)
k=a1
l=b1
yfit1=np.array([])
for x in xfit1:
yfit1=np.append(yfit1,Freundlichfit(x))
print("The fit coefficient at {0} is: ".format(T1),a1,b1)#,aerr1,berr1)
if ifheat == "Y" or ifheat == "y":
x=x2
y=y2
result2=leastsq(Freundlich,[1,1])
a2,b2=result1[0]
#aerr2,berr2=result2[1]
xfit2=np.linspace(0,np.max(x2),GRID,endpoint=True)
k=a2
l=b2
yfit2=np.array([])
for x in xfit2:
yfit2=np.append(yfit2,Freundlichfit(x))
print("The fit coefficient at {0} is: ".format(T2),a2,b2)#,aerr2,berr2)
#################################################################################################
if ifheat == "Y" or ifheat == "y":
DP=np.array([])
Qfin=np.array([])
length=0
for i in range(GRID):
for j in range(GRID):
if abs(yfit1[i]-yfit2[j])<1E-6 and xfit2[j] != 0:
DP=np.append(DP,xfit1[i]/xfit2[j])
Qfin=np.append(Qfin,yfit1[i])
length+=1
continue
DH=np.zeros([length])
for k in range(length):
DH[i]=R*math.log(DP[k])/(1/T2-1/T1)
with open('Output.csv','w',newline='') as csvfile:
Owriter=csv.writer(csvfile)
Owriter.writerow('Q','DH')
for k in range(length):
Owriter.writerow([Qfin[k],DH[k]])
#################################################################################################
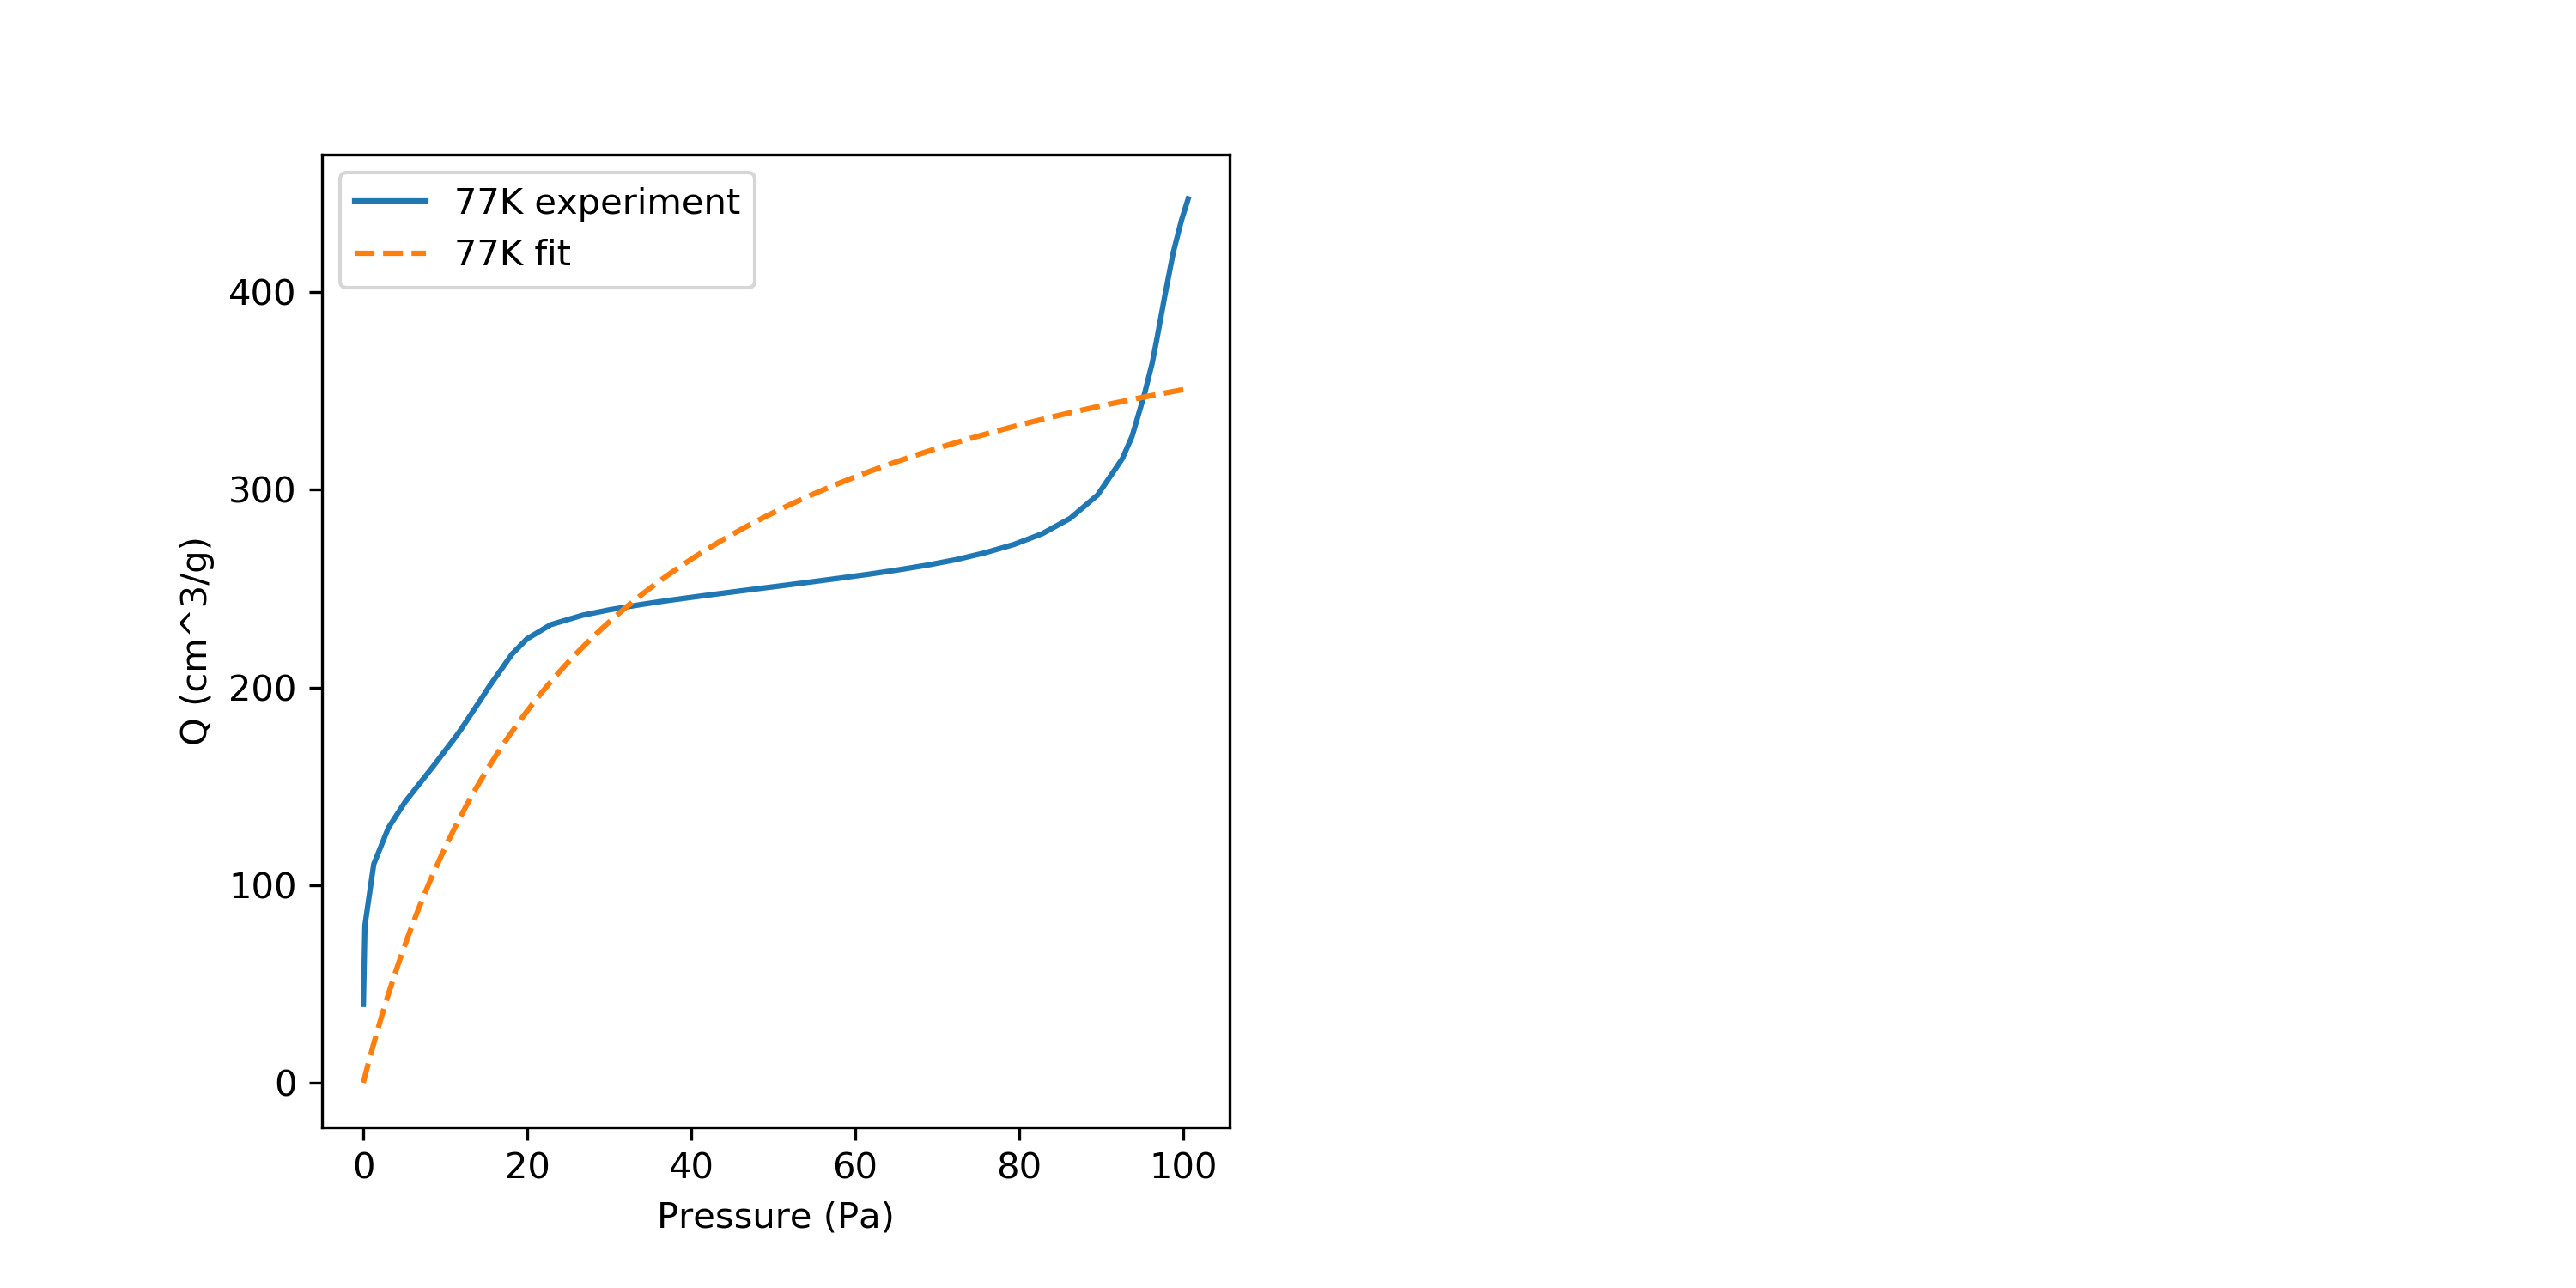
plt.figure(figsize=(10,5),dpi=80)
ax1=plt.subplot(1,2,1)
plt.sca(ax1)
plt.xlabel("Pressure (Pa)")
plt.ylabel("Q (cm^3/g)")
plt.plot(x1,y1,label="{0}K experiment".format(T1))
plt.plot(xfit1,yfit1,label="{0}K fit".format(T1),linestyle="--")
plt.legend(loc="upper left")
if ifheat == "Y" or ifheat == "y":
ax2=plt.subplot(1,2,2)
plt.sca(ax1)
plt.plot(x2,y2,label="{0}K experiment".format(T2))
plt.plot(xfit2,yfit2,label="{0}K fit".format(T2),linestyle="--")
plt.sca(ax2)
#ax2.plt.xlabel()
#ax2.plt.ylabel()
plt.plot(DP,Qfin)
plt.savefig("Absorption.png",dpi=300)
plt.show()
在程序中首次尝试的内容
-
使用Pandas库中的
read_excel()函数读取excel文件,使用方法与numpy.loadtxt()类似,同样拥有usecols,skiprows等参数,其usecols可以直接赋值为字符串,对应excel中的列标字母。注意对于没有header的内容需要加上header=None,否则第一行内容会被认为是列标题。read_excel()返回的是一个元组,要读取多列内容时不能使用x,y=的形式,得分别赋值。 -
使用Csv库中的
writer()函数将内容输出到csv文件,其使用方法与C++中的ofstream类似,需先定义一个类名称Qwriter=csv.writer(),然后通过该名称的.writerow()函数将内容以行的形式输出。 -
使用Matplotlib.pyplot库中的
subplot函数进行多子图的图表绘制。使用时首先通过赋值的方式ax1=subplot(1,2,1)确定子图的名称与位置,在绘图时则通过sca(ax1)函数声明在该子图中绘图。
一些小细节
-
对于
nan数字的判断,numpy库中的isnan()函数可以实现。 -
对于字符串的格式化输出,可以使用
format()函数实现。具体形式为"{0} is NO.1".format(a)或"{a1} is NO.1".format(a1=a) -
Python中的函数内变量与全局变量互通,这点与C++不同。
问题与不足
-
在读取BET仪器直接生成的xls格式文件时发生了错误,似乎
pandas.read_excel()对旧格式的excel文件不是很支持。目前需要另存为xlsx格式再使用。 -
在尝试将程序打包为exe执行文件时出现了无法创建
***.zip的错误,还未能解决。 -
目前手头没有数据,所以没有对计算吸附焓的部分进行验算,不过根据之前C++的结果来看,应该没什么问题。
其他
在Windows环境下,检查pip各个库的版本使用命令: pip list
更新库使用命令: pip install -U xxx
若出现权限问题,则使用: pip install -U xxx --user